The Challenge
Beef + Lamb New Zealand is funded by beef and sheep farmers across New Zealand and is responsible for the global promotion of environmentally sustainable quality beef and lamb.
With over 90% of production being exported to over 120 countries, the total value of production in 2018 was $10.4b ($7.5b worth exports and $2.9b worth domestic sales). It has become massively important to improve operational efficiency across the business by leveraging data from various internal business systems as well as external data to gain accurate insights and drive actions.
Walkerscott have been engaged to work with the Economic Services Team at Beef + Lamb as a trusted digital transformation partner, to demonstrate capabilities of Microsoft Applications, and bring in incremental value to the business. The objective was to enable seamless and quick access to data, by building visually interactive Power BI reports to represent slaughter data collected from industry sources.
The Solution and Outcome
DATA SOURCES
- Weekly slaughter data from NZ Meat Board
- Flat Files for Stock Sales & Carcase Weights
RESULTS: Seamless Access
UNDERSTANDING DATA & LOGICS
- Understanding dimensional hierarchies to classify species into their categories, this year vs last year and 5 years average etc.,
- Elimination of data reconciliation issues caused in excel based reports
- Creation of Lucid Chart based report wire-frames to ensure the client is aware of the design, way ahead in the project lifecycle
RESULTS: Cohesive View of Data
POWER BI REPORTS
- Interactive Power BI dashboards for Weekly Slaughter & Stock Sales
- Integration of ESRI for map based visualizations for increased level of accuracy
- Avoids issues related to data reconciliation and data redundancy
- Reduces manual intervention to prepare excel-based reports substantially
RESULTS: Visual Storytelling
SELF SERVICE BI
- Effective visualizations which enables intuitive understanding of multi-dimensional data
- Logical drill down’s with effective visual storytelling
- Dynamically share key insights across the organization
- Ability to download PPT and PDF files & share it with colleagues
RESULTS: Operational Efficiency
Weekly Slaughter Report
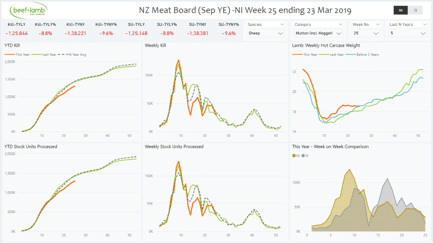
- This year’s week on week comparison of slaughter by species & related stock units processed by North Island, South Island & both.
- Allows the user to plot last year and last N years average alongside this year (N is the number of years to include in the average calculation) which is dynamic.
Stock Sales Report
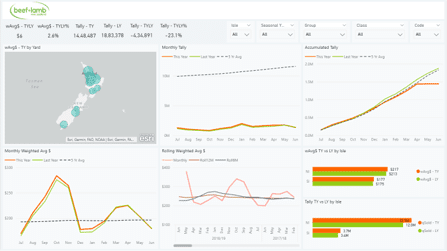
- Visualizes average $ of stock sales by individual yards in New Zealand, integration of ESRI provides increased level of accuracy.
- Key metrics like Monthly Tally and Accumulated Tally are plotted month-on-month alongside of this year, last year and 5 year averages.